
anydoc
Convert office documents and text-based PDFs to Markdown locally.
Find insights and make sense of your data.

Browse alphabetically. Open a product to see its sources and limits.
Convert office documents and text-based PDFs to Markdown locally.
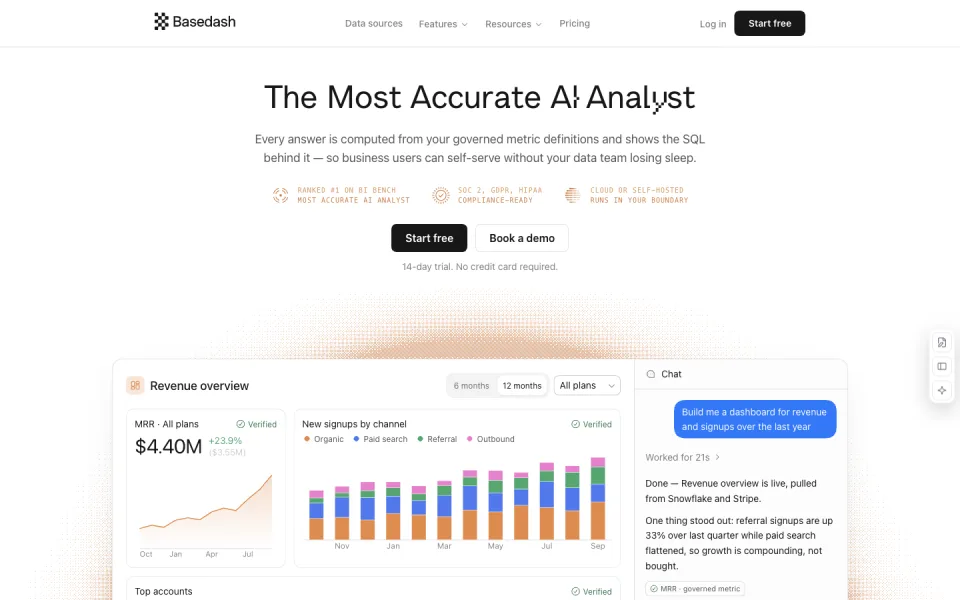

A data agent that writes SQL and builds dashboards from connected data.
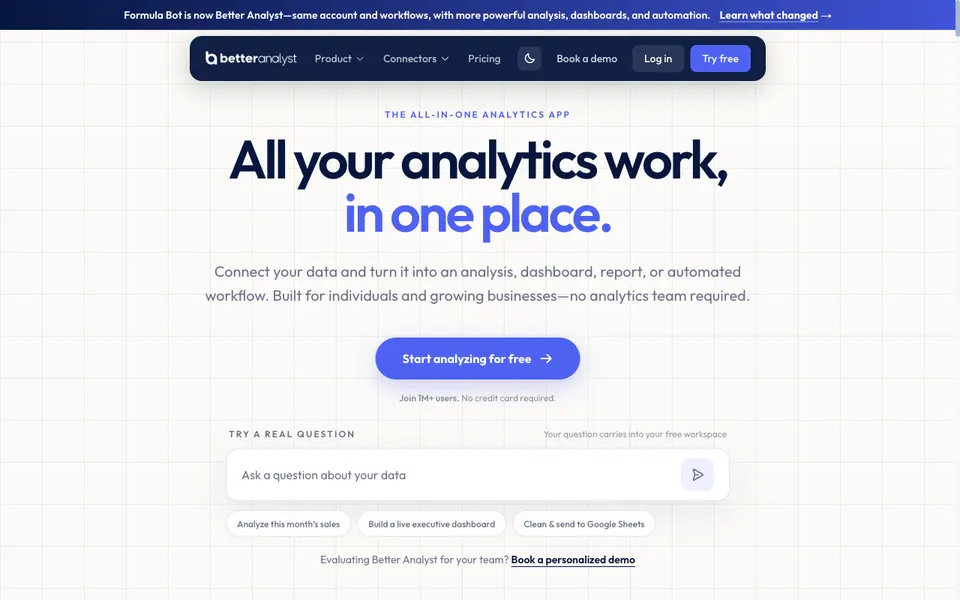

All-in-one analytics app for analysis, dashboards, and automated workflows.
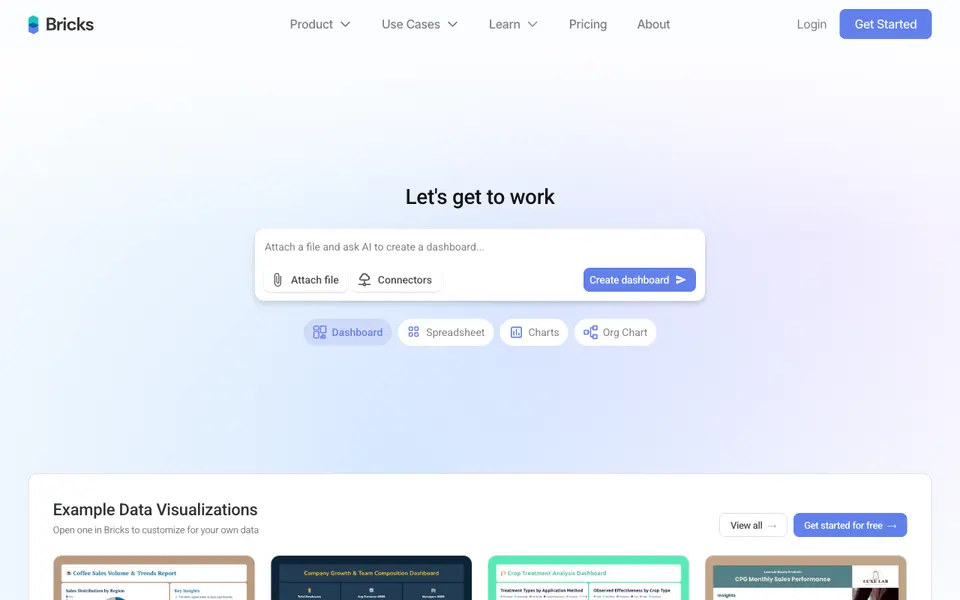

AI data analyst that turns CSV/Excel/PDF files into dashboards and reports.
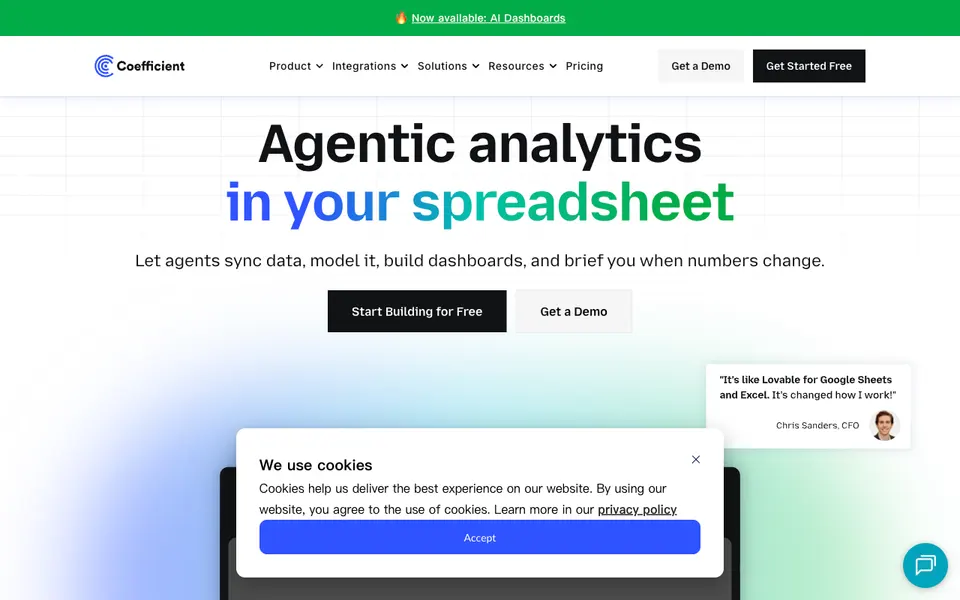

Live data from business systems inside Google Sheets and Excel.
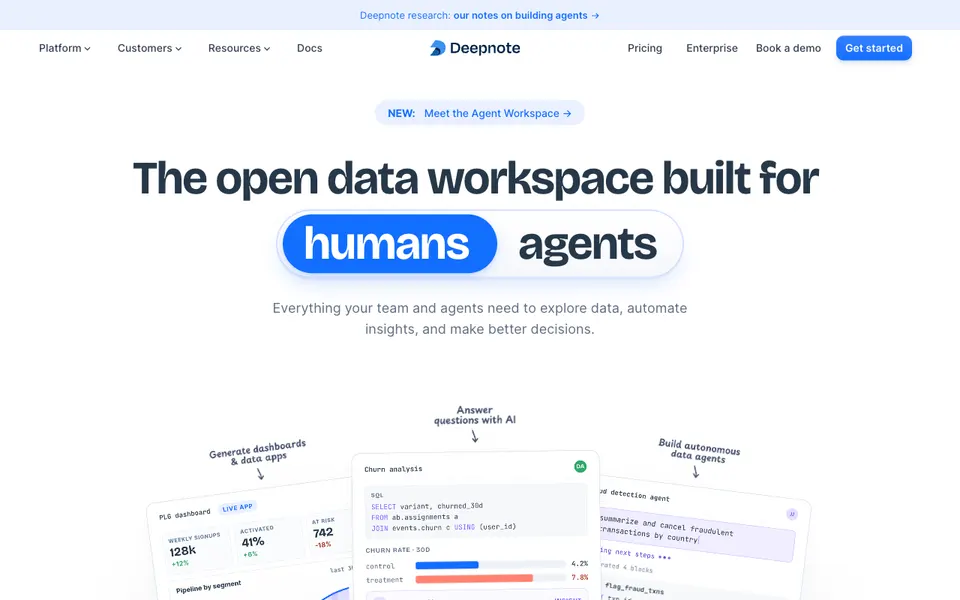

Collaborative data notebook platform with AI, SQL, and Python.
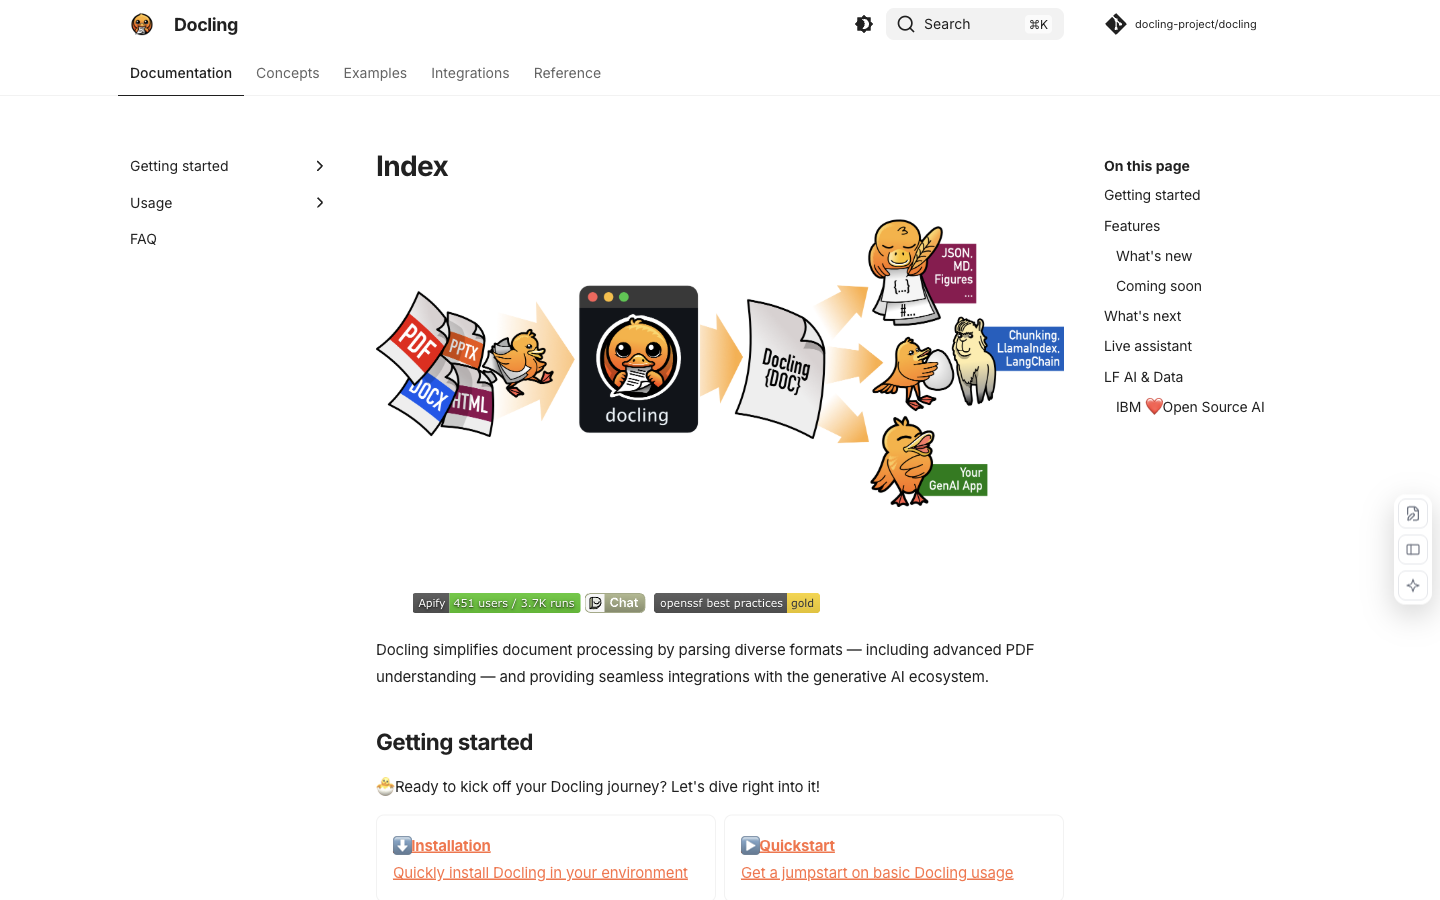

Convert documents into structured text with layout, table and OCR processing for downstream AI applications.
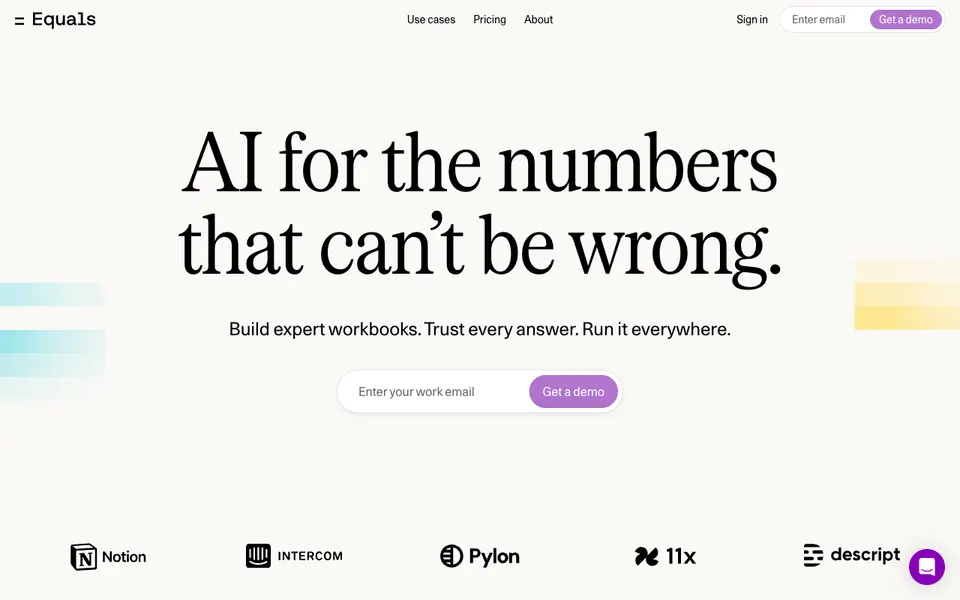

Spreadsheet and workbooks with AI for trustworthy numbers.
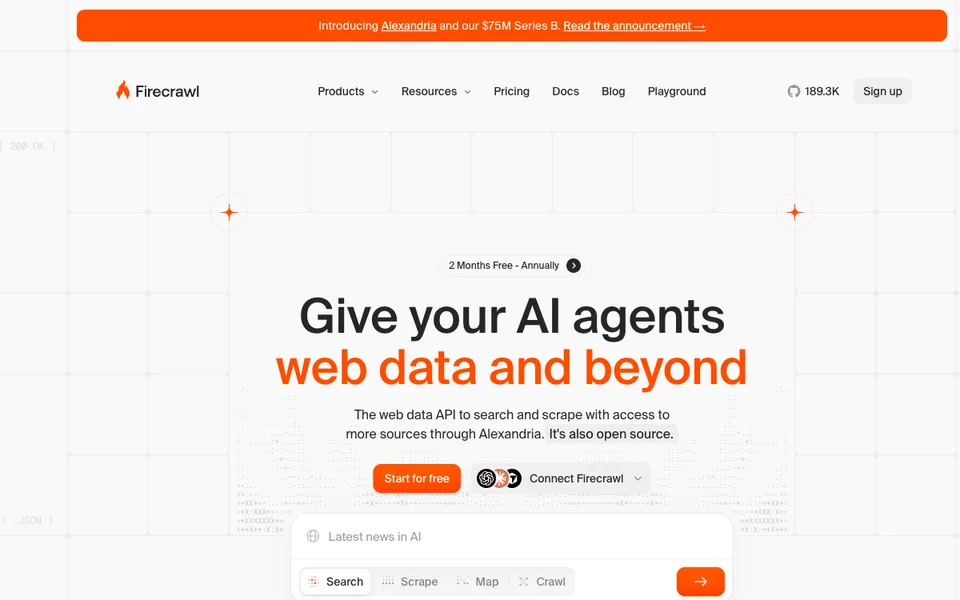

Fetch web content as Markdown or structured data for downstream AI use.
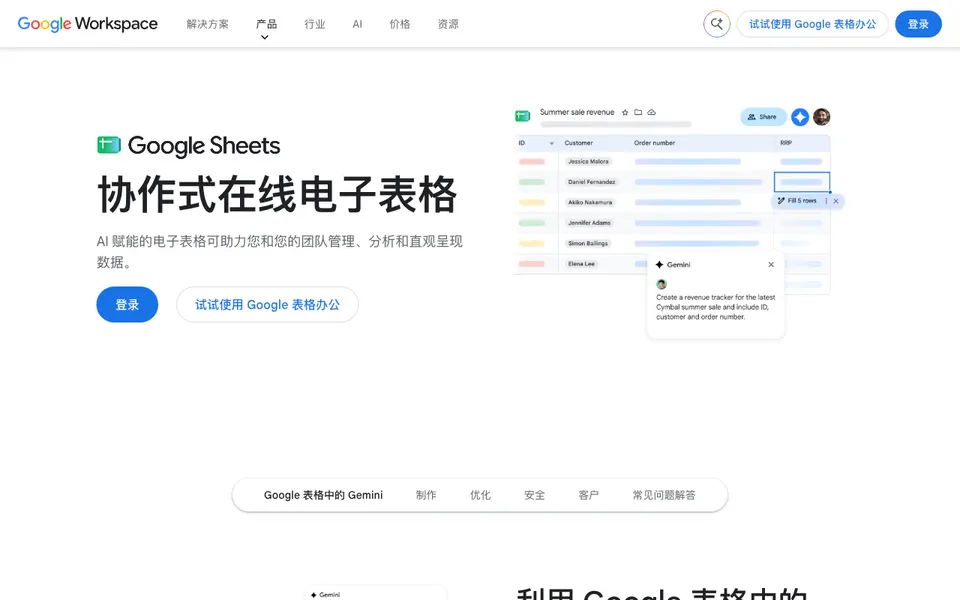

Gemini assistant inside Google Sheets for tables, formulas, and analysis.
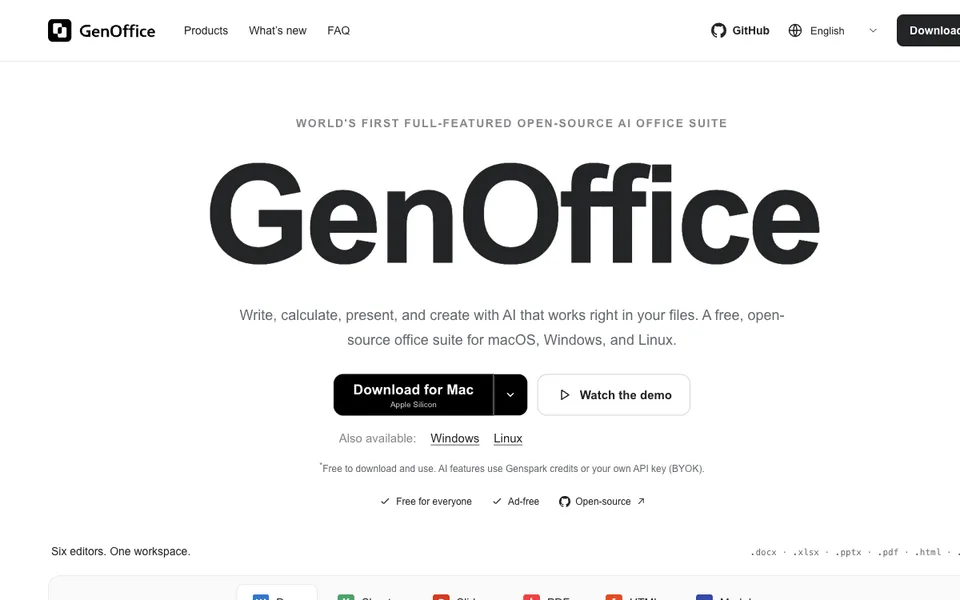

Edit office files with AI-assisted changes that remain reviewable and editable.
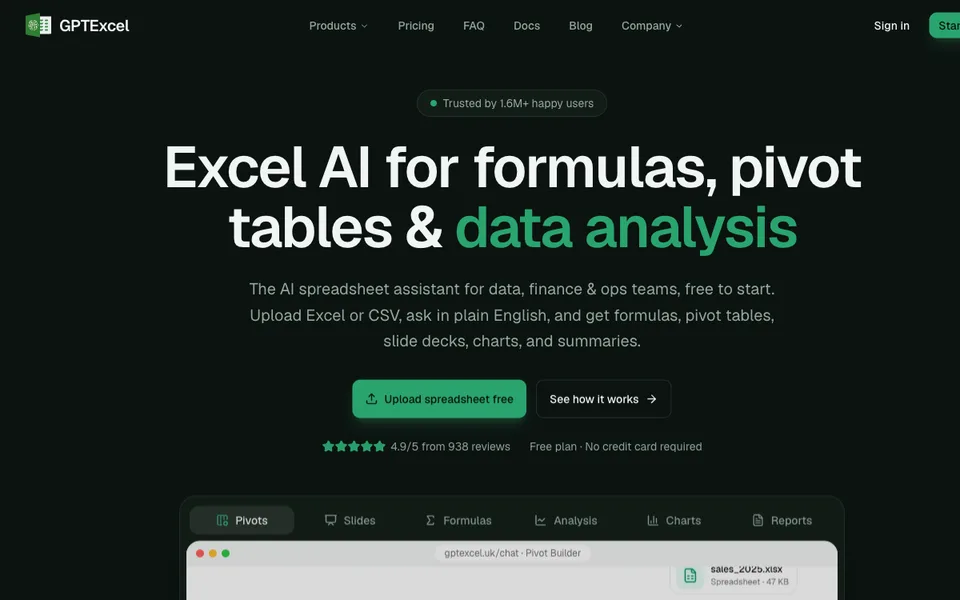

An AI spreadsheet assistant for formulas, pivot tables, charts and data analysis.

Choose Graphy when the main task is turning a checked table into a shareable interactive chart with a clear visual story.
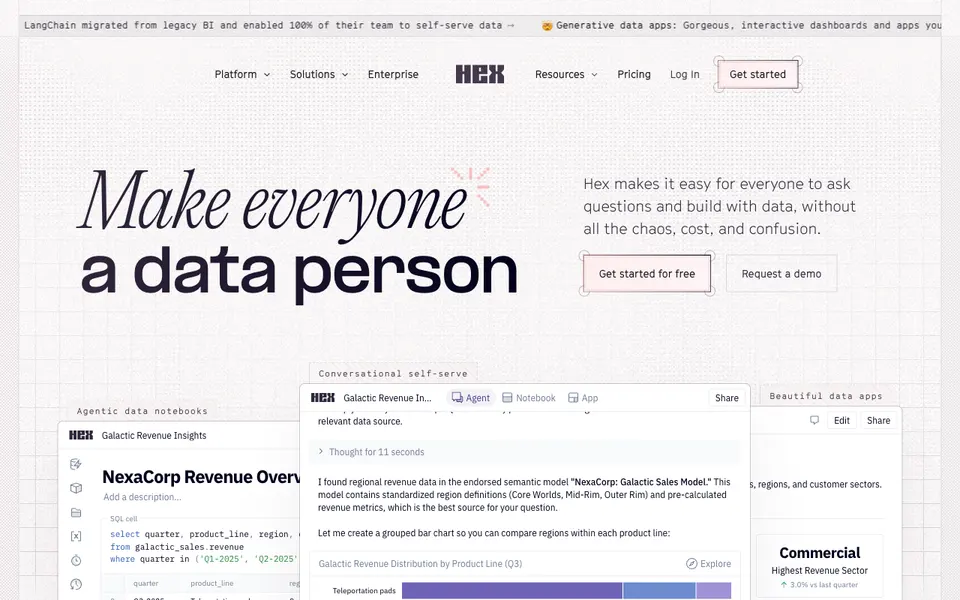

Agentic data notebooks for analysis, apps, and dashboards.

Analyze spreadsheets and data in plain English and create reports.
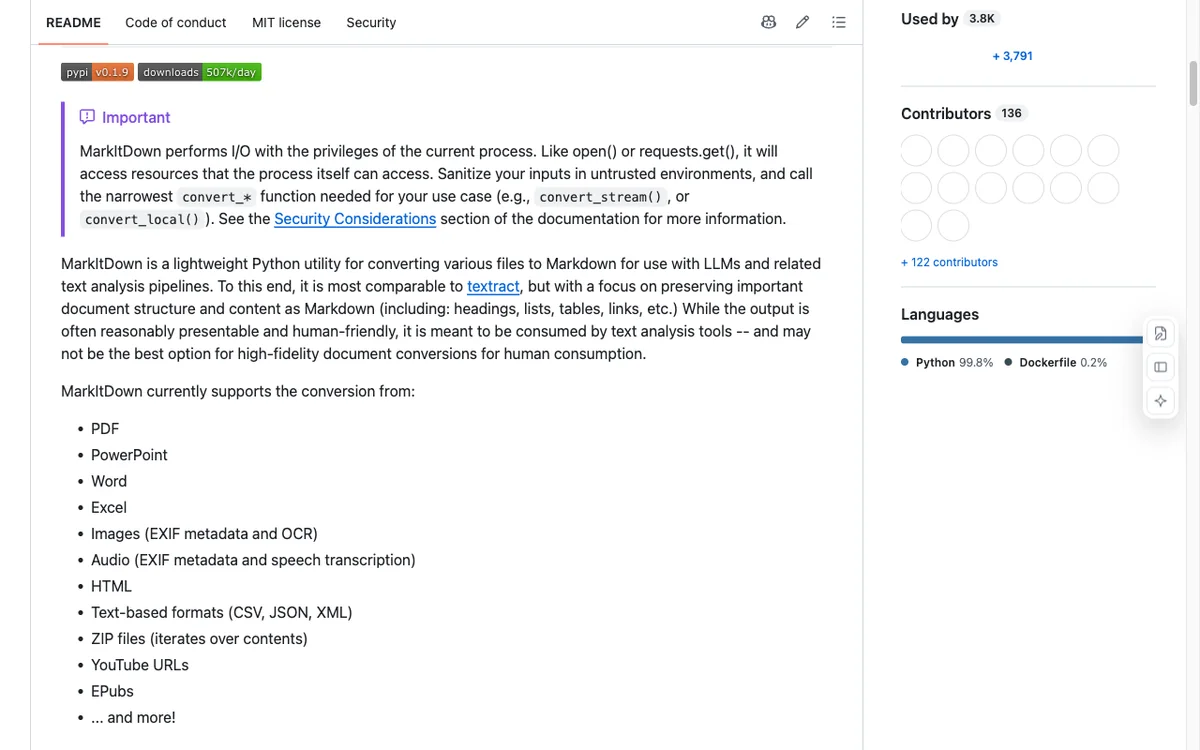

Microsoft MarkItDown converts documents and supported media into Markdown for LLM and text-analysis pipelines.
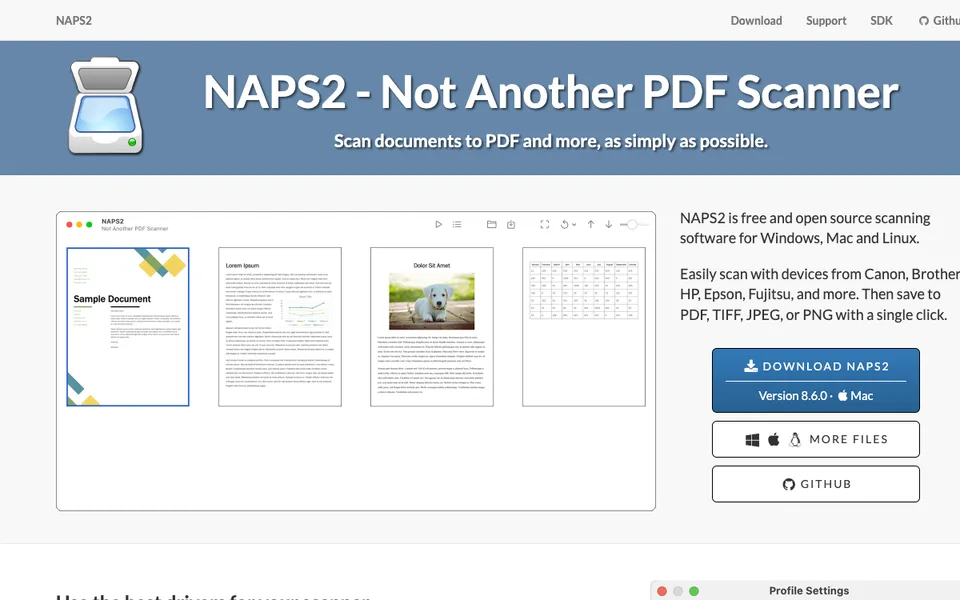

Scan paper through a desktop interface and save searchable PDFs after page cleanup and ordering.
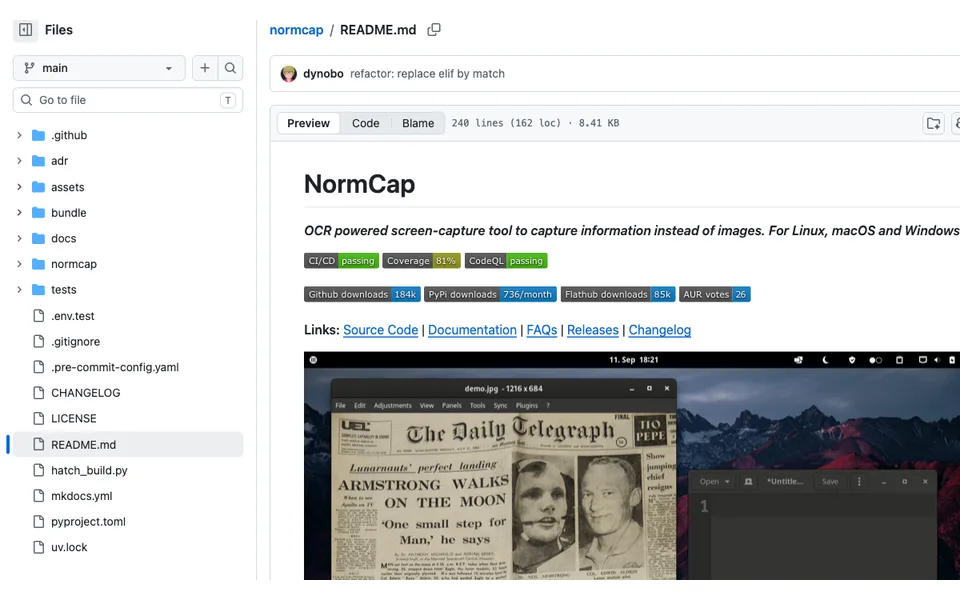

Capture text from a selected screen region through a lightweight local OCR workflow.
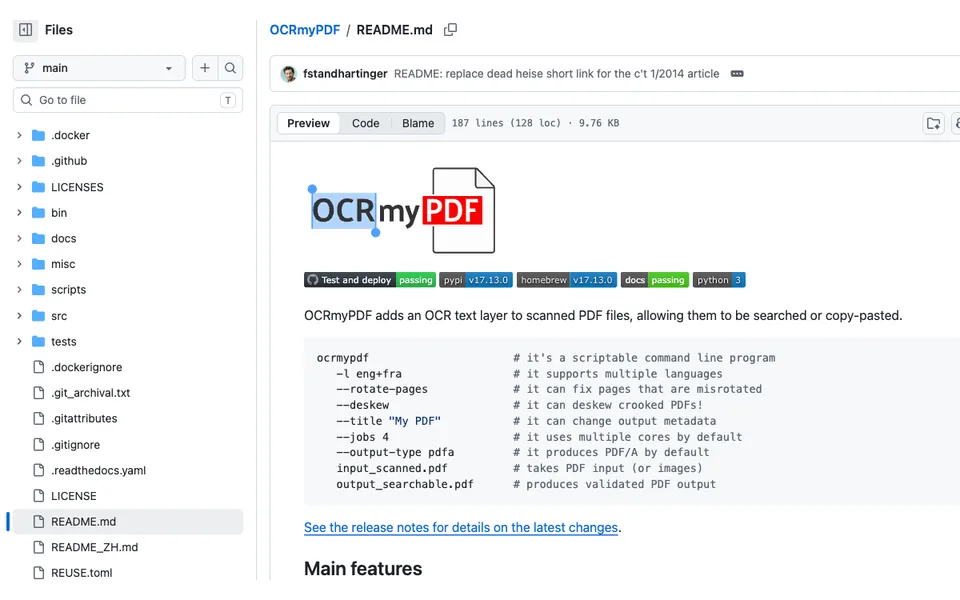

Add a searchable text layer to scanned PDFs with explicit OCR languages and archival-output choices.
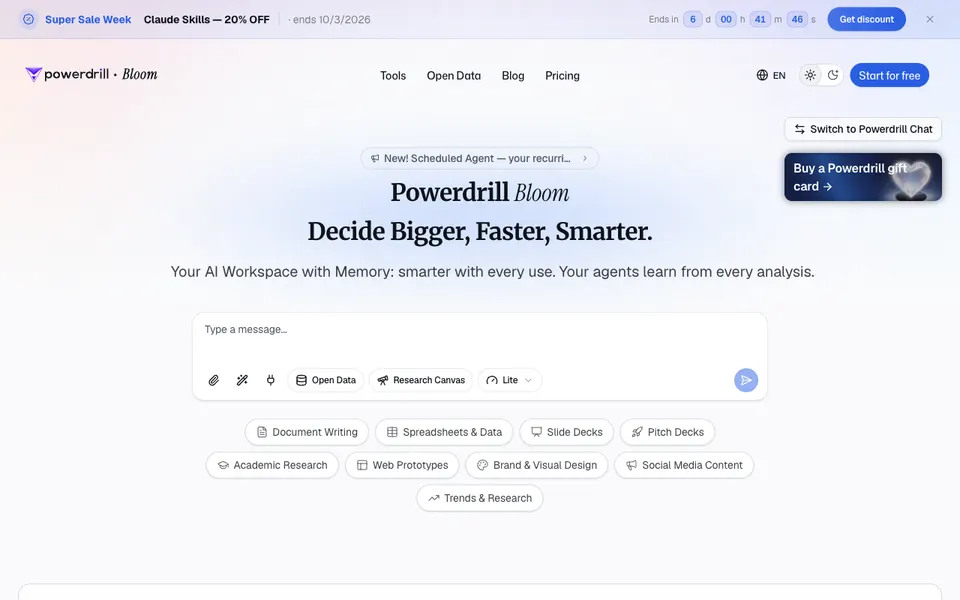

AI data-analysis workspace with memory, provenance, and scheduled agents.
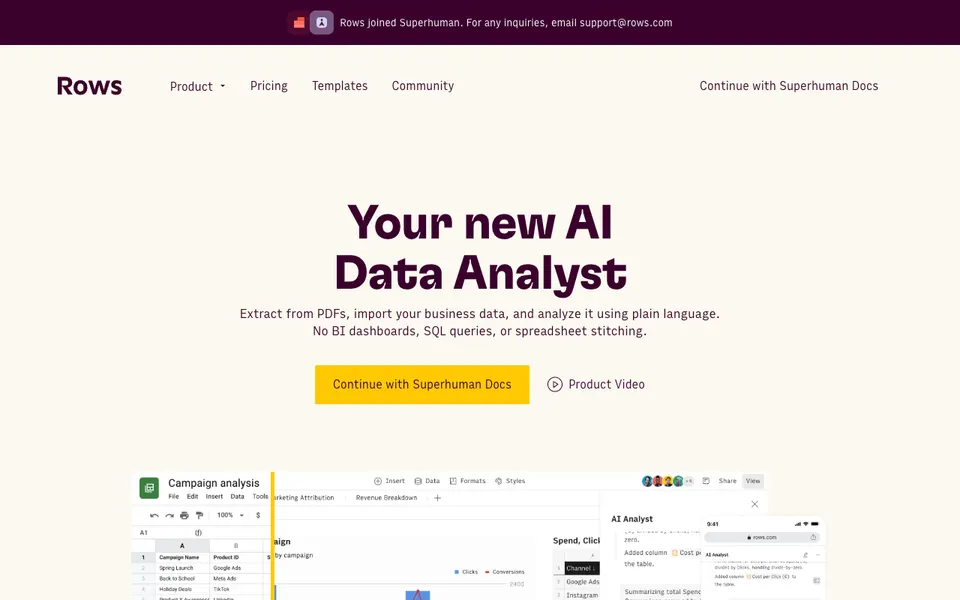

Spreadsheet with an AI data analyst that imports, analyzes, and reports.

Extract text from image batches while excluding repeated watermark or header regions.
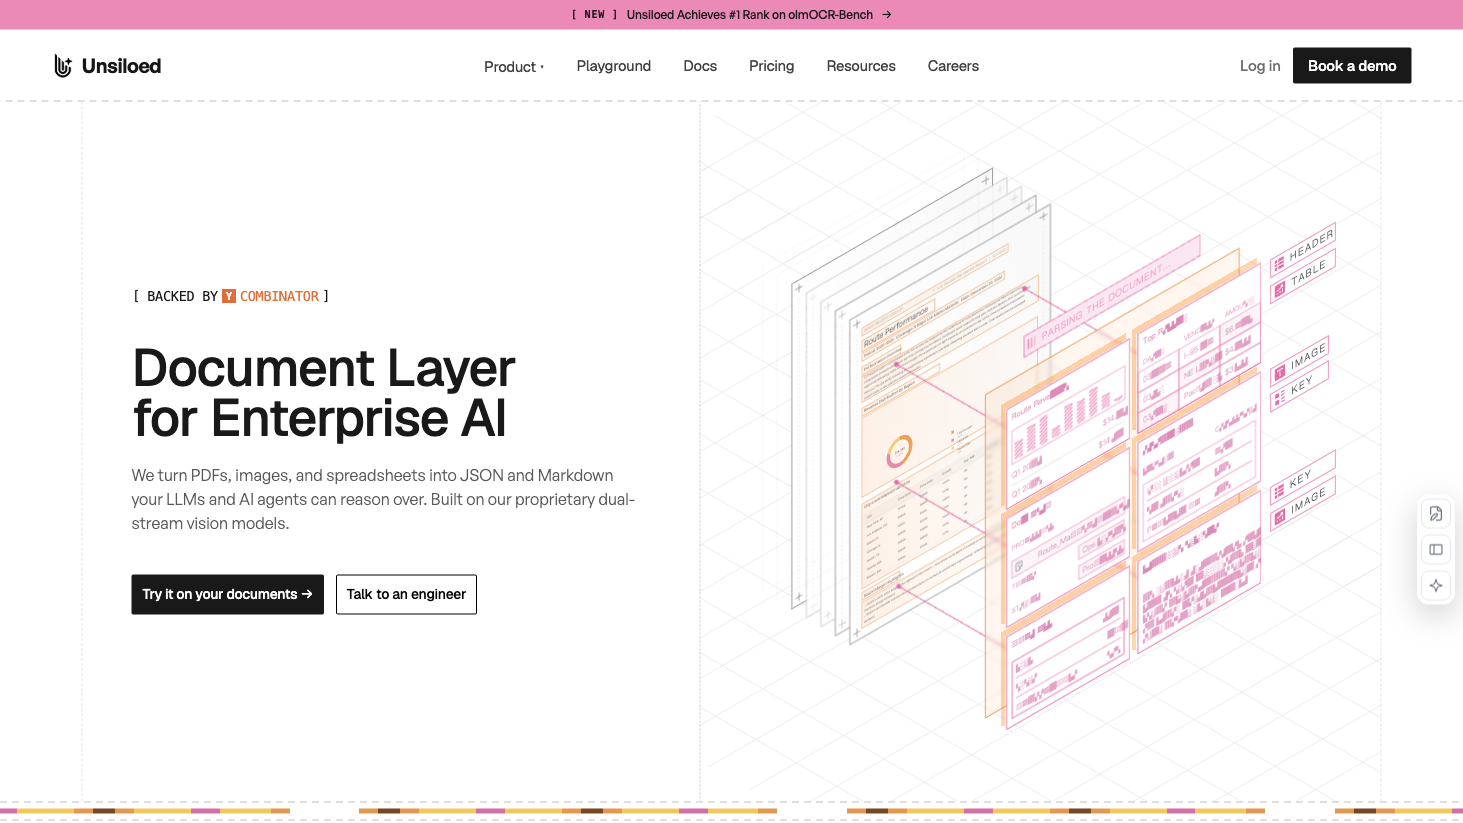

Parse PDFs, scans and spreadsheets into structured JSON and Markdown for AI workflows.
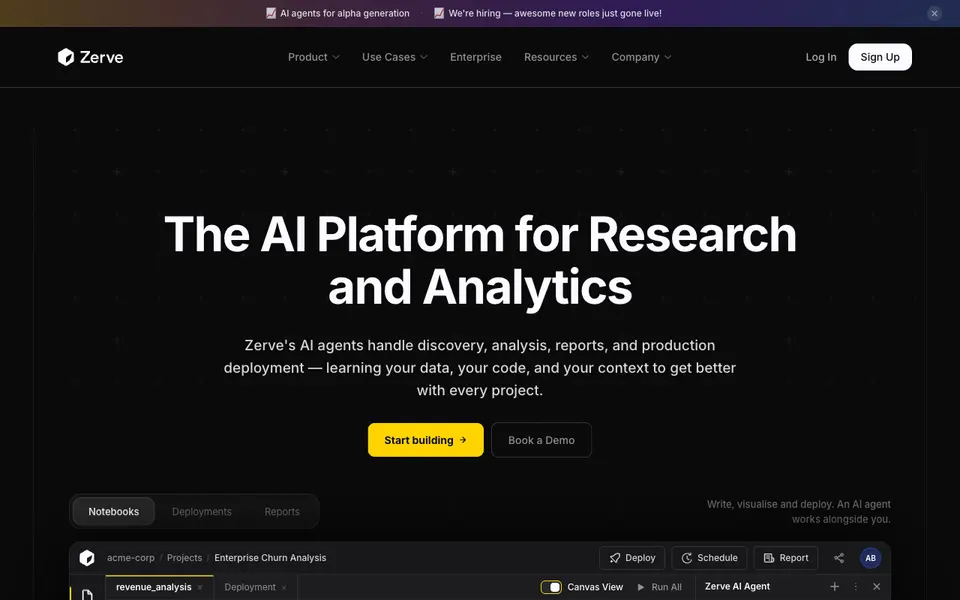

AI platform for analytics with agentic notebooks and conversational reports.
Try another filter. Use the heart on a product to save it to your account.
Tell us what you need →AI data analyst and AI data analysis tools describe the same selection job here: turn your data into a result you can inspect. Choose the working environment before comparing subscription prices. A polished chart is not proof of a correct calculation.
| Starting option | Data environment | Result to inspect | Before uploading |
|---|---|---|---|
| Julius AI | A file or connected Drive data for a question-led analysis. | Review calculations behind charts and reports, then inspect the exported values. | Check supported formats, file-size limits and usage credits in the current plan. |
| Rows | A spreadsheet working with imported documents and connected business sources. | Inspect cells, formulas, source refresh and the report you share. | Rows now links to Superhuman Docs. Confirm the current signup, workspace access and plan before migrating. |
| Hex | A notebook and app workflow around warehouse or file data. | Inspect SQL or Python cells, upstream data and the published report. | Confirm data-source permissions, workspace access and the paid features required. |
Julius is a starting option for file-based analysis. Preserve the original CSV or spreadsheet and reconcile the numbers; this comparison is not a new Julius product test.
Free is available. Plus costs USD 20/month on monthly billing and includes 2,000 monthly credits for one seat. Pro is USD 45/month with 5,000 monthly credits. More complex or repeated analysis can use more credits; check the selected billing cycle before paying.
Official pricing ↗Pricing checked:
Consider Rows for a spreadsheet workflow. Its official site says it joined Superhuman; verify the product and integration path rather than assuming an old account workflow still applies.
Free plan plus paid Pro and Enterprise plans with per-user and per-workspace pricing.
Official pricing ↗Pricing review pending
Consider Hex when teammates need inspectable code and a repeatable data workflow. Verify credentials, source access and refresh behavior before treating a report as current.
Free individual tier plus Team and Enterprise plans; compute profiles are free or paid.
Official pricing ↗Pricing review pending
Use the existing 12-row synthetic order sample to make this decision concrete. The task is to total paid orders, exclude refunded rows and explain the calculation. The recorded result used Pi; it is not a shared product benchmark or a Better Analyst test.
Better Analyst: choose a browser upload workflow after checking access and limits. Pi Agent: choose a terminal workflow when you can inspect files and configure model access. Both profiles show pricing sources and the actual pricing review date.
Selection uses documented product capabilities, not a shared performance test. Rows and Hex official pages were reviewed October 8, 2026; Julius retains the source review date shown in its profile because this round could not refresh its official site.
Editorial evaluation plan. These checks are proposed steps, not recorded product tests.
Create a fictional file with five orders: amounts 10, 20, 30, 40 and 50. Mark the final order cancelled. Ask for total completed-order revenue; the expected result is 100, with the cancelled row excluded. Then add a duplicate identifier and check how the tool explains it. This is a proposed check, not a recorded product run.
Julius lists spreadsheets, CSV or Excel files, Google Drive data and plain-language questions. Rows lists uploaded files and PDFs, connected business tools, and website tables through an extension. Hex lists data warehouse connections and SQL or Python. Choose the candidate whose inputs match your sample and note each stated requirement, such as an account or warehouse.
Ask for a number you already know, such as a monthly total or average, and save the prompt or query that produced it. For Hex, review the notebook rather than only the chart. For spreadsheet work, check that the tool read the right columns and did not treat text as numbers, then keep the artefact.
Compare the tool's figure with your hand calculation and the source rows, and log any gap. Then export in the format you chose: Julius describes charts, reports and exports, Rows describes live reports and shareable sheets, and Hex describes published apps and dashboards. Check the export opens for the person receiving it.
Stop if the tool cannot read your sample safely, if the number cannot be reproduced, or if a total cannot be traced back to source rows.
Check the selected seat or workspace tier, credits and compute charges. Save the usage for the same small calculation; longer notebooks and repeated runs may consume a different allowance.
Choose by workflow fit. This shortlist is editorial, and its order is not a performance ranking.
Julius AIFits quick file or Drive analysis with plain-language questions and exports.
Check the fit Credit-based usage, and results still need verification against your source.
Free is available. Plus costs USD 20/month on monthly billing and includes 2,000 monthly credits for one seat. Pro is USD 45/month with 5,000 monthly credits. More complex or repeated analysis can use more credits; check the selected billing cycle before paying.
Official pricing ↗Pricing checked:
RowsFits teams turning uploaded files and connected data into live reports.
Check the fit Best suited to tabular data; the site states Rows joined Superhuman and advanced features sit on higher tiers.
Free plan plus paid Pro and Enterprise plans with per-user and per-workspace pricing.
Official pricing ↗Pricing review pending
HexFits data teams working from a warehouse with notebooks and published apps.
Check the fit Aimed at data teams, needs a warehouse or data connection, and team and enterprise features are paid.
Free individual tier plus Team and Enterprise plans; compute profiles are free or paid.
Official pricing ↗Pricing review pending
Check the product page and try your sample. Julius lists spreadsheet files and Drive inputs, Rows describes files and connected business data, and Hex supports data connections with SQL or Python. Those are different requirements.
No. Inspect the calculation, excluded rows and missing values. Save the source sample and query or notebook so another person can check how the result was produced.
Compare file uploads, spreadsheet workflows and code notebooks. Choose around your input format and how you need to check the result.
Ask questions about a supported spreadsheet or document file. Confirm input formats and inspect the calculations behind summaries.
Julius AIReady to use · Free accessBricksReady to use · Free accessPowerdrillReady to use · Free accessBefore choosing Reconcile totals, excluded rows and chart labels against the source file.
Keep analysis close to cells, formulas or connected business data. Compare supported spreadsheet environments and connection requirements.
Gemini in Google SheetsRequires setup · PaidCoefficientRequires setup · Free accessRowsReady to use · Free accessBefore choosing Review formulas and source permissions before refreshing or sharing data.
Use code and notebooks when you need to inspect and repeat an analysis. Check data connections and environment requirements.
Before choosing Rerun the analysis and reconcile its calculations with the original data.
24 listed products, by how you can start
Free access can still involve paid model usage, hosting or connected services. Check each product's pricing notes.
Choose around files, spreadsheets or notebooks. Check calculation evidence alongside product information.
A spreadsheet assistant works close to cells and formulas. A notebook is useful when you need code and a repeatable analysis. A reporting tool can help present results, but presentation is separate from calculation accuracy.
Use a small sample with clear column definitions. Ask for the calculation or code behind each number. Reconcile totals, excluded rows and missing values against the original file before sharing the report.
Explore tabular data, ask questions and create a report you can trace back to the numbers.
A CSV or spreadsheet and a specific business question
An analysis, charts or an editable report
Check totals, missing values, formulas and whether the data supports the conclusion.
A spreadsheet assistant fits cell-based work. A notebook or data analyst agent may suit multi-step analysis with code you can inspect.
Analyze spreadsheets and data in plain English and create reports.
Why it fits Julius states it analyzes spreadsheets in plain English and generates reports and presentations.
PrepareSpreadsheets, CSV, or Excel files
GetCharts and visualizations
ReviewUpload data or connect Drive
Spreadsheet with an AI data analyst that imports, analyzes, and reports.
Why it fits Rows states AI extracts from PDFs, imports business data, and analyzes it in a spreadsheet.
PrepareUploaded files and PDFs
GetLive spreadsheets and reports
ReviewImport or connect data
Agentic data notebooks for analysis, apps, and dashboards.
Why it fits Hex states it offers agentic data notebooks where everyone can ask questions and build with data.
PrepareData warehouse connections
GetNotebooks
ReviewConnect a data source
AI data analyst that turns CSV/Excel/PDF files into dashboards and reports.
Why it fits Bricks states it is an AI data analyst that instantly creates dashboards and reports from CSV, Excel, or PDF data.
PrepareCSV, Excel, or PDF files
GetDashboards
ReviewUpload a file
All-in-one analytics app for analysis, dashboards, and automated workflows.
Why it fits The site states Formula Bot is now Better Analyst and describes connecting data and turning it into analysis, dashboards, reports, and automated workflows.
PrepareConnected data sources
GetAnalysis
ReviewConnect a source
Live data from business systems inside Google Sheets and Excel.
Why it fits Coefficient states it puts live data in spreadsheets and dashboards from connected systems.
PrepareGoogle Sheets or Excel
GetLive spreadsheet data
ReviewInstall the add-on
Spreadsheet and workbooks with AI for trustworthy numbers.
Why it fits Equals combines spreadsheet-style workbooks with AI assistance and connected business data for analysis.
PrepareA spreadsheet or workbook
GetWorkbooks and dashboards
ReviewCreate a workbook
Collaborative data notebook platform with AI, SQL, and Python.
Why it fits Deepnote lists data analytics, data apps and dashboards, SQL/Python, and alerts for metrics.
PrepareData sources
GetNotebooks
ReviewCreate a notebook
AI data-analysis workspace with memory, provenance, and scheduled agents.
Why it fits Powerdrill states it analyzes documents and databases with every number traceable to its source and offers scheduled agents.
PrepareExcel, CSV, PDF, and docs
GetInsights, charts, and summaries
ReviewUpload files or pick open data
AI platform for analytics with agentic notebooks and conversational reports.
Why it fits Zerve states its AI agents handle discovery, analysis, reports, and production deployment for research and analytics.
PrepareData warehouse or sources
GetAnalyses
ReviewConnect data
Gemini assistant inside Google Sheets for tables, formulas, and analysis.
Why it fits Google's support page states Gemini in Sheets can create tables and formulas and generate data analysis and insights.
PrepareGoogle Sheets data, including specific tabs or tables
GetTables and pivot tables
ReviewOpen a Google Sheet

Open-source coding agent for terminal-based work with local files.
Why it fits In the recorded Agenlify run, Pi read a 12-row CSV and generated a Python calculation script and a reconciled report.
PrepareA CSV file, column meanings and the question to answer
GetA Markdown report and reproducible Python calculations
ReviewCheck row selection and independently recompute key totals
A data agent that writes SQL and builds dashboards from connected data.
Why it fits The Dashboard Agent announcement describes choosing charts, writing SQL and arranging a dashboard; official guidance explains SQL review.
PrepareA connected database or warehouse and defined business metrics
GetExecuted SQL, charts and complete dashboards
ReviewInspect SQL, joins and metric definitions against known results
Edit office files with AI-assisted changes that remain reviewable and editable.
Why it fits Task links are limited to the documented workflow. Infrastructure and model components are not treated as ready-made end-user agents.
PrepareAn authorized DOCX, XLSX or PPTX file and an edit request
GetEdited documents, spreadsheets or slide files
ReviewCheck tracked changes, formulas and saved-file compatibility against the original.